IoT Internal Monitoring Kit Set Up

Contents

What's Included

  • IoT Developer Board
  • I2C Interface
  • Environmental Sensor
  • Light Sensor
  • 2 x Sensor Extension Cables
  • USB Cable
  • Power Adapter

Connecting the Sensors

Included in the kit are two sensors: environmental and light. The environmental sensor measures temperature, pressure and humidity. The light sensor measures light level.

The I2C interface has four connectors. An edge connector and three sensor connectors. Notice the three sensor connectors on the I2C interface have the following labels. (left to right)

  • SDA
  • SCL
  • GND
  • VIN or 3V3

These labels match those on the sensors.

Connect each sensor to the I2C interface ensuring the connector labels align. See figure 2.

The sensors are now connected.

Figure 1

Figure 2

Connecting to a Wi-Fi Network

A smartphone or PC is required

Figure 3

Ensure the IoT developer board is not powered by disconnecting any power supply connected to it.

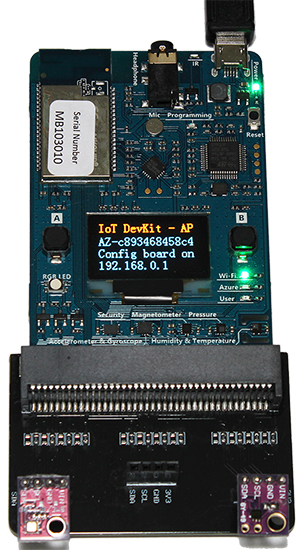
Connect the IoT developer board to the edge connector on the I2C interface. See figure 3.

Connect the USB cable to the power adapter and IoT developer board.

Once you have powered the device, press and hold button B, whilst holding button B press the reset button once. This will activate the access point mode. This mode allows you to connect the IoT developer board to your chosen Wi-Fi network.

Once activated some information will show on the IoT developer board display. This information is required to connect to a Wi-Fi network.

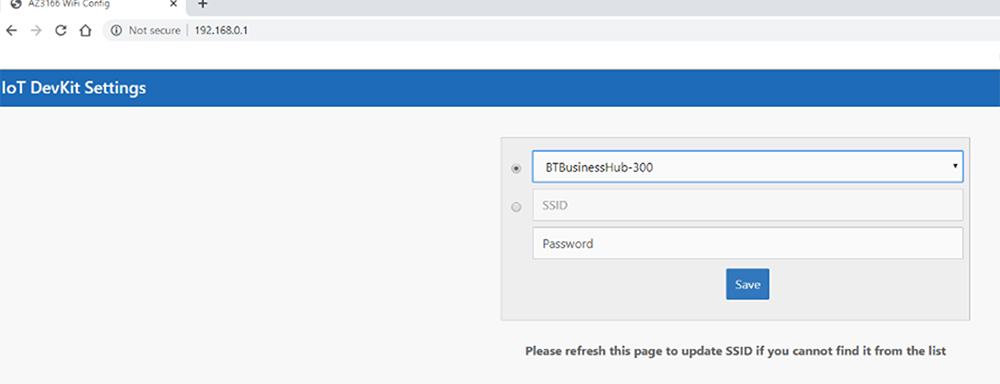
The information on the second row is known as an SSID (wireless network name). Using another Wi-Fi compatible device such as a smartphone or PC, search the available Wi-Fi networks for this SSID. The example in figure 3 is AZ-c89346845956. Select the SSID to connect to it.

Once connected, open a browser, and type the IP address found on the fourth row on the screen into the URL bar. In the figure 3 example the IP address is 192.168.0.1.


You will see a window as shown in figure 4. Select your Wi-Fi from the dropdown list, then enter your Wi-Fi password into the box labelled ‘Password’.


Your IoT Internal Monitoring Kit will now try to connect to your Wi-Fi network.

Figure 4

The IoT Internal Monitoring Kit will begin connecting to the Wi-Fi network set. This process will include three screens.

The first screen displays the device is powered and is attempting to connect to the Wi-Fi network set.

The second screen shows it has successfully connected to the Wi-Fi network. Errors will be displayed if incorrect details were set when connecting to the Wi-Fi network. If the device does not connect, retry the ‘Connecting to a Wi-Fi network’ process.

A Blue LED will turn on once the device has connected to the IoT system, labelled Azure.

Your device has now connected to the Wi-Fi network and IoT system. Here you can see the sensor readings displayed.

  • Temperature
  • Relative Humidity
  • Pressure
  • Sound
  • Light

Finding your Device in the Exploratory

Now your device will now be uploading data and it is time to find it in the IoT Exploratory. You will need to wait a minimum of 10 minutes to allow the IoT Internal Monitoring Kit to send its first data point to the IoT Exploratory.


Go to the IoT Exploratory tool in the menu bar at the top of this page and open it in a new tab.


All IoT devices in the IoT Exploratory ecosystem have a unique device ID that identifies them. This example device ID is illustrated in figure 5.


In the IoT Exploratory tool you can find your device in the devices list using this device ID.


To understand how to build data sets and analyse the data from yours and other IoT devices see the Getting Started guide.

Figure 5

Keep in Touch

Keep up to date with new IoT Exploratory features and devices, training sessions, other news and events.